Use data imported from a csv file with spaces in the header

When importing data from a csv file(dataSpace.csv) that has headers with spaces in the middle of some of the fields there is need to address the data slightly differently in order for it to be used easily in your JavaScript.

1
2
Date Purchased,close
1-May-12,58.13

When we go to import the data using the d3.csv function, we need to reference the Data Purchased column in a way that makes allowances for the space. The following piece of script appears to be the most basic solution.

1
2
3
4
5
6
d3.csv('dataSpace.csv', (err, data) => {
if (err) throw err;
data.forEach(d => {
d.date = parseTime(d['Date Purchased'])
})
})

Histogram

The d3.histogram function allows us to form our data into ‘bins’ that form ‘discrete samples into continous, non-overlapping intervals’.

1
2
3
4
5
6
7
8
9
10
11
12
13
14
15
16
17
18
19
20
21
22
23
24
25
26
27
28
29
30
31
32
33
34
35
36
37
38
39
40
41
42
43
44
45
46
47
48
49
50
// dtg,value
// 01-08-2010,3
// 01-08-2010,3
// 01-08-2010,3
// 01-08-2010,3
// 01-08-2010,3.1
// 01-08-2010,3.2
// 01-08-2010,3.2
// .
// .
// .
// 31-12-2011,3.2
// 31-12-2011,3.3
// 31-12-2011,3.4
// 31-12-2011,3.5
// 31-12-2011,3.5
// 31-12-2011,4.1
// 31-12-2011,4.9

// core code

const parseDate = d3.timeParser('%d-%m-%Y')

const xScale = d3.scaleTime()
.domain([new Date(2010, 6, 3), new Date(2012, 0, 1)])
.rangeRound([, width])

const yScale = d3.scaleLinear()
.range([height, 0])

const histogram = h3.histogram()
.value(d => d.date)
.domain(xScale.domain())
.thresholds(x.ticks.timeMonth)

const _data = data.map(d => ({
date: parseDate(d.dtg),
value: d.value,
}))

const bins = histogram(_data)

holder.selectAll('rect')
.data(bins)
.enter().append('rect')
.attr('class', 'bar')
.attr('x', 1)
.attr('transform', d => `translate(${xScale(d.x0)}, ${yScale(d.length)})`)
.attr('width', d => (xScale(d.x1 - d.x0) - 1))
.attr('height', d => (height - yScale(d.length)))

The key line

1
const bins = histogram(_data)

groups the data for the bars.

Tree Diagram

The data requied to produce this type of layout needs to describe the relationships, but this is not necessary an onerous task.

1
2
3
4
5
6
7
8
9
10
11
12
13
14
15
16
17
18
19
{
"name": "Top Node",
"children": [
{
"name": "Bob: Child of Top Node",
"children": [
{
"name": "Son of Bob"
},
{
"name": "Daughter of Bob"
}
]
},
{
"name": "Sally: Child of Top Node"
}
]
}
1
2
3
4
5
6
7
8
9
10
11
12
13
14
15
16
17
18
19
20
21
22
23
24
25
26
27
28
29
30
31
32
33
34
35
36
37
38
39
40
41
42
43
44
45
46
47
48
49
50
51
52
53
54
55
56
57
58
59
60
61
62
63
64
65
66
67
68
69
70
71
72
73
// core code
const treeData = {
"name": "Top Level",
"children": [
{
"name": "Level 2: A",
"children": [
{ "name": "Son of A" },
{ "name": "Daughter of A" }
]
},
{ "name", "Leve 2: B"}
]
}

const margin = {
top: 40,
right: 30,
bottom: 50,
left: 30,
}
const width = 660 - margin.left - margin.right
const height = 500 - margin.top - margin.bottom

// declare a tree layout and assigns the size
const treemap = d3.tree()
.size([width, height])

// assigns the node data to the tree layout
let nodes = d3.hierarchy(treeData)

// map the node data to the tree layout
nodes = treemap(nodes)

// append the svg object to the body of the page
// append a 'group' element to 'svg'
// move the 'groupd' element to the top left margin
const svg = d3.select('body').append('svg')
.attr('width', width + margin.left + margin.right)
.attr('height', height + margin.top + margin.bottom)
const g = svg.append('g')
.attr('transform', `translate(${margin.left}, ${margin.top})`)

// add links between nodes
const link = g.selectAll('.link')
.data(nodes.descendants().slice(1))
.enter().append('path')
.attr('class', 'link')
.attr('d', d => {
return `M${d.x},${d.y}C${d.x},${(d.y + d.parent.y) / 2} ${d.parent.x},${(d.y + d.parent.y) / 2} ${d.parent.x},${d.parent.y}`
})

// add each node as a group
const node = g.selectAll('.node')
.data(nodes.descendants())
.enter().append('circle')
.attr('class', d => {
return `node ${d.children ? 'node--internal' : 'node--leaf'}`
})
.attr('transform', d => {
`translate(${d.x}, ${d.y})`
})

// add the circle to node
node.append('circle')
.attr('r', 10)

// add the text to the node
node.append('text')
.attr('dy', '0.35em')
.attr('y', d => (d.children ? -20 : 20))
.style('text-anchor', 'middle')
.text(d => d.data.name)
1
2
3
4
5
6
7
8
9
// declare a tree layout and assign the size
const treemap = d3.tree()
.size([width, height])

// assign the data to a hierarchy using parent-child relationships
let nodes = d3.hierarchy(treeData)

// maps the node data to the tree layout
nodes = treemap(nodes)
d3.hierarchy
1
const nodes = d3.hierarchy(treeData, d => d.children)

This assigns a range of properties to each node including:

  • node.data - the data assocaited with the node(in our case it will include the name accessible as node.data.name).

  • node.depth - a representation of the depth or number of hops from the initial root node.

  • node.height - the greatest distance from any descendants leaf nodes.

  • node.parent - the parent node, or null if it’s the root node.

  • node.children - child nodes or undefined for any leaf nodes.

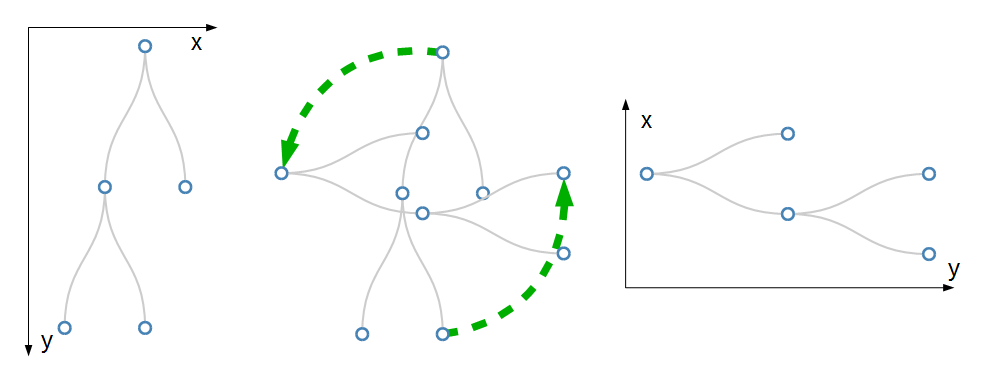
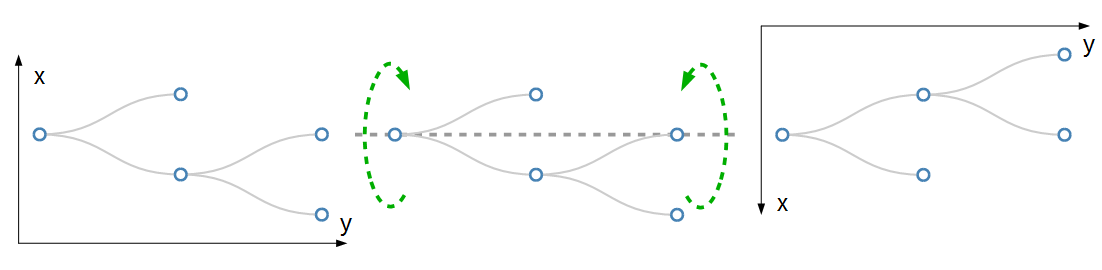
Above is the vertical tree map code.

If you want a horizontal tree map, you can make a transform like this.

Or

1
2
3
4
5
6
7
8
9
10
.attr('d', d => {
return `
M${d.y},${d.x}
C${(d.y + d.parent.y)/2},${d.x}
${(d.y + d.parent.y)/2},${d.parent.x}
${d.parent.y},${d.parent.x}
`
})

.attr('transform', d => `translate(${d.y}, ${d.x})`)

Add Images as Node

1
2
3
4
5
6
node.append('image')
.attr('xlink:href', d => d.data.icon)
.attr('x', '-12px')
.attr('y', '-12px')
.attr('width', '24px')
.attr('height', '24px')

Add Interaction on Node

1
2
3
4
5
6
7
8
9
10
function click (d) {
if (d.children) {
d._children = d.children
d.chilren = null
} else {
d.children = d._children
d._children = null
}
upate(d)
}

Sankey Diagrams

// Todo

Assorted Tips and Tricks

Events

  • mousedown

  • mouseup

  • mouseover

  • mouseout

  • mousemove

  • click

  • contextmenu

  • dblclick

Add Tooltips

Tooltips have a marvellous duality. They are on one hand a pretty darned useful thing that aids in giving context and information where required and on the other hand, if done with a bit of care they can look stylish.

1
2
3
4
5
6
7
8
9
10
11
12
div.tooltip {
position: absolute;
text-align: center;
width: 60px;
height: 28px;
padding: 2px;
font: 12px sans-serif;
background: lightsteelblue;
border: 0px;
border-radius: 8px;
pointer-events: none;
}
1
2
3
4
5
6
7
8
9
10
11
12
13
14
15
16
17
18
19
20
21
22
const div = d3.select('body').append('div').attr('class', 'tooltip')
.style('opacity', 0)

svg.selectAll("circle")
.data(data)
.enter().append("circle")
.attr("r", 5)
.attr("cx", function(d) { return x(d.date); })
.attr("cy", function(d) { return y(d.close); })
.on("mouseover", function(d) {
div.transition()
.duration(200)
.style("opacity", .9);
div.html(formatTime(d.date) + "<br/>" + d.close)
.style("left", (d3.event.pageX) + "px")
.style("top", (d3.event.pageY - 28) + "px");
})
.on("mouseout", function(d) {
div.transition()
.duration(500)
.style("opacity", 0);
})

Notice there is only one tooltip exist in the page.

Selecting/Filtering a subset of objects

Filtering is fairly simple.

1
2
3
4
5
6
7
8
svg.selectAll('circle')
.data(data)
.enter().append('circle')
.filter(d => d.close < 400)
.style('fill', 'red')
.attr('r', 5)
.attr('cx', d => xScale(d.date))
.attr('cy', d => yScale(d.close))

Select Items with an IF statement

1
2
3
4
5
.style("fill", function(d) {   
if (d.close <= 400) {return "red"}
else if (d.close >= 620) {return "lawngreen"} // <== Right here
else { return "black" }
})

Applying a color gradient to a line based on value

1
2
3
4
5
.line {
fill: none;
stroke: url(#line-gradient);
stroke-width: 2px;
}
1
2
3
4
5
6
7
8
9
10
11
12
13
14
15
16
17
18
19
20
21
22
23
24
25
// set the gradient

// add linear gradient element
svg.append('linearGradent')
// add id for css anchor
.attr('id', 'line-gradient')
.attr('gradientUnits', 'userSpaceOnUse')
// use x1, y1, x2, y2 to define the bounds of the area over which the gradient will act.
// here we set x1, x2 to the same value so the gradient won't act on x direction.
.attr('x1', 0).attr('y1', yScale(0))
.attr('x2', 0).attr('y2', yScale(1000))
// select all 'stop' elements for the gradients, these 'stop' elements define where on the range covered by our coordinates the color start and stop(percent or decimal)
.selectAll('stop')
.data([
{offset: '0%', color: 'red'},
{offset: '40%', color: 'red'},
{offset: '40%', color: 'black'},
{offset: '62%', color: 'black'},
{offset: '62%', color: 'lawngreen'},
{offset: '100%', color: 'lawngreen'},
])
.enter().append('stop')
.attr('offset', d => d.offset)
.attr('stop-color', d => d.color)

There is our anchor on the third line.

If you want to apply the gradient on area, simply change the css

.area {
  fill: url(#area-gradient);
  stroke-width: 0px;
}