d3.shape
Visualization typically consist of discrete graphical marks, such as Symbols, arcs, lines and areas. While the ractangles of a bar chart may be easy enough to generate directly using SVG or Canvas, other shapes are complex, such as roudned annular sectors and centripetal Catmull-Rom splines. This module provides a variety of shape generators for your convenience.
As with other aspects of D3, these shapes are driven by data: each shape generator exposes accessors that control how the input data are mapped to a visual representation.
You might define a line generator for a time series by scaling field of your data to fit the chart.
1 | const lineGen = d3.line() |
This line generator can then be used to compute the d attribute of an SVG path element:
1 | path.datum(data).attr('d', lineGen) |
Or you can use it to render to a Canvas 2D context:
1 | lineGen.context(context)(data) |
Installing
1 | <script src="https://d3js.org/d3-path.v1.min.js"></script> |
or
1 | yarn add d3-shape |
Arcs
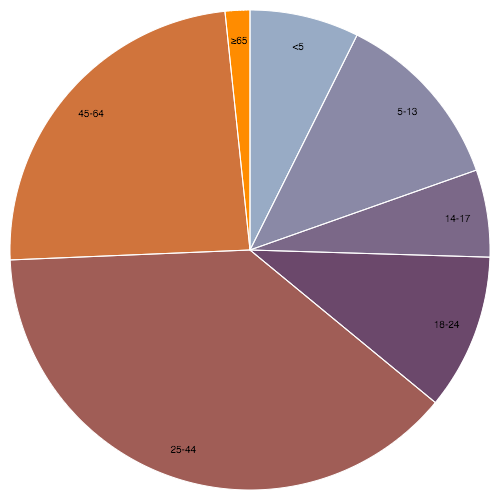
The arc genrateor produces a circular or annular sector, as in a pie or donut chart. If the difference between the start and end angles(the regular span) is greater than 2 * Math.PI, the arc generator will produce a complete circle or annulus. If it is less than 2 * Math.PI, arcs may have rounded corners and angular padding.
Arcs are always centered at <0, 0>, use a transform to move the arc to a different position.
1 | const arc = d3.arc() // construct a new arc genrator with default settings. |
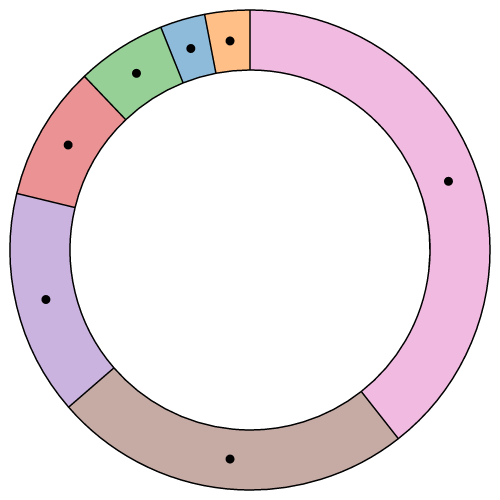
arc.centroid(arguments) computes the midpoint <x, y> of the center line of the arc that would be generated by the given arguments. The arguments are arbitrary. They are simple propagated to the arc generator’s accessor functions along with the this object.
To be consistent with the generated arc, the accessors must be deterministirc, i.e., return the same value given the same arguments. The midpoint is defined as (startAngle + endAngle) / 2 and (innerRadius + outerRadius) / 2
arc.cornerRadius([radius]) sets the corner radius to the specified function or number and returns the arc generator.
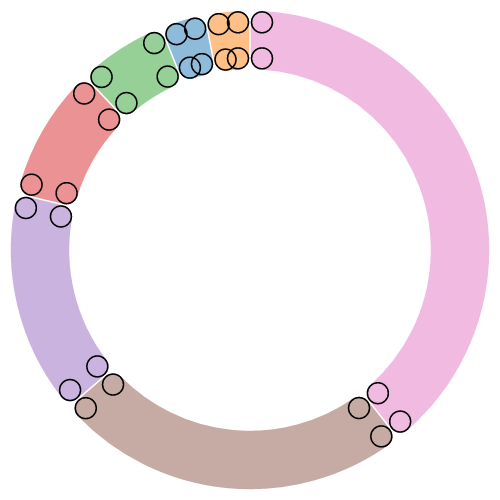
arc.padAngle([angle]) sets the pad angle to the specifid function or number and returns this arc generator. The pad angle is converted to a fixed linear distances seperateing adajacent arcs, defined as *padRadius * padAngle*.
arc.context([context]) sets the context and returns this arc generator. If context is not specified, returns the current context, which defaults to null. If the context is not null, then the generated arc is rendered to this context as a sequence of path method calls. Otherwise, a path data string representing the generated arc is returned.
Pies
This pie generator does not produce a shape directly, but instead computes the necessary angles to represent a tabular dataset as a pie or donut chart. These angles can be passed to an arc generator.
d3.pie() constructs a new pie generator with the default settings.
pie(data[, arguments]) generates a pie for the given array of data, returning an array of objects representing each datum’s arc angle. Any additional arguments are arbitrary. They are simply propagated to the pie generator’s accessor functions along with the this object.
The length of the returned array is the same as data and each element i in the returned array corresponds to the element i in the input data. Each object in the returned array has the following properties:
data: the input datum; the corresponding element in the input data array.
value: the numeric value of the arc
index: the zero-based sorted index of arc
startAgnle: the start angle of the arc
endAngle: the end angle of the arc
padAngle: the pad angle of the arc
1 | var data = [1, 1, 2, 3, 5, 8, 13, 21]; |
The first pair of parens, pie() constructs a default pie generator, the second pie()(data) invokes this generator on the dataset, returning an array of objects.
Note that the returned array is in the same order as the data.
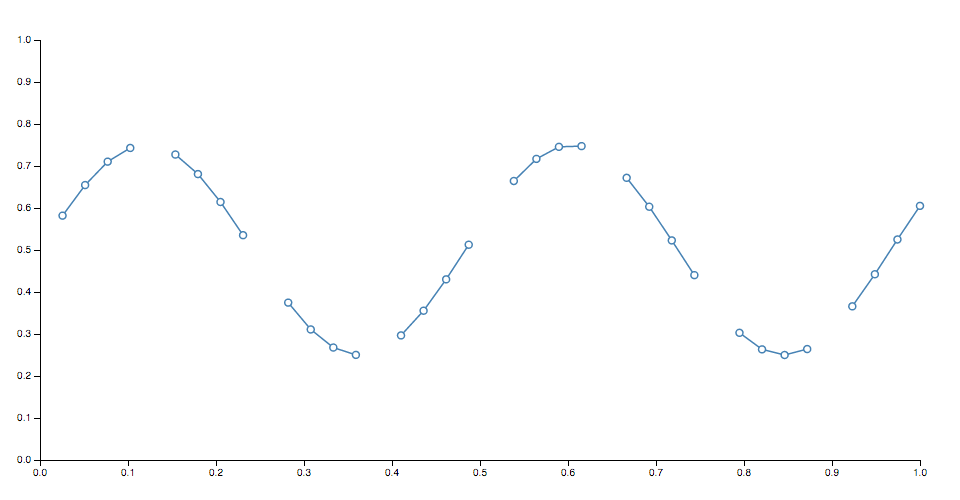
Lines
The line generator produces a spline or polyline, as in a line chart. Lines also appear in many other visualization types, such as the links in hierarchical edge bundling.
d3.line() constructs a new line generator with default settings.
line(data) generates a line for the given array of data. Depending on this line generator’s assciated curve, the given input data may need to be sorted by x-value before being passed to the line generator. If the line generator has a context, then the line is rendered to this context as a sequence of path method calls and this function returns void.
line.x(fn) specifies the x accessor.
line.y(fn) specifies the y accessor.
line.defined([defined]) sets the defined accessor.
line.curve([curve]) sets the curve factory and returns this line genrator. If curve is not specified, returns the current curve factory, which defaults to curveLinear.
d3.lineRadial() constructs a new radial line generator with the default settings.
A radial line generator is equivalent to the standard cartesian line generator, except the x and y accessor are replaced with angle and readius accessors.
Radial lines are always positioned relative to <0, 0>, use a transform to change the origin.
Areas
The area generator produces an area, as in an area chart. An area is defined by two bounding lines, either splines or polilines. Typically two lines share the same x-value, differing only in y-value; most commonly, y0 is defined as a constant representing zero. The first line (the top line) is defined by x1 and y1 and is rendered first; the second line (the base line) is defined by x0 and y0 and is rendered second, with the points in reverse order.
d3.area() constructs a new area generator with the default settings.
area.data() generats area for the given array of data. Depending on this area generator’s associated curve.
area.x([x]) sets x0 to x and x1 to null.
area.x0() sets the x0 accessor.
area.defined()
d3.areaRadial()
Curves
Curves are typically not constructed or used directly, insread being passed to line.curve and arec.curve. For example:
1 | var line = d3.line() |
d3.curveBasis(context)
d3.curveBasisClosed(context)
d3.curveBasisOpen(context)
d3.curveBundle(context)
d3.curveCardinal(context)
d3.curveCardinalClosed(context)
d3.curveLinear(context)
d3.curveStep(context)
d3.curveStepAfter(context)
d3.curveStepBefore(context)
Links
The link shape generates a smooth cubic Bezier curve from a source point to a target point. The tangents of the curve at the start and end are either vertical, horizontal, or radial.
d3.linkVertical(), returns a new link generator with vertical tangents.
1 | var link = d3.linkVertical() |
d3.linkHorizontal(), returns a new link generator with horizontal tangents.
1 | var link = d3.linkHorizontal() |
Stacks
Some shape types can be stakced, placing one shape adjacent to another.
Stacked charts can show overall value and per-category value simultaneously.
d3.stack(), constructs a new stack generator with the default settings.
stack(data[, arguments]), generates a stack for the given array of data, returning an array of representing each series. Any additional arguments are arbitrary, they are simply propagated to accessors along with this object.
The series are determined by the keys accessor; each series i in the returned array corresponds to the i th key. Each series is an array o points, where each point j corresponds to the j th element in the input data.
1 | var data = [ |
stack.keys([keys]), sets the keys accessor to the specified function or array and returns this stack generator.
stack.order([order]), sets the order accessor to the specified functino or array and returns this stack generator. If order is not specified, returns the current order accessor, which default to stackOrderNone, this uses the order given by the key accessor.
d3.stackOrderAscending(series)
d3.stackOrderDescending(series)
d3.stackOrderInsideOut(series)
d3.stackOrderNone(series)
d3.stackOrderReverse(series)
stack.offset([offest]), sets the offset accessor to the specified function or array, and returns this stack generator. If no offset is specified, returns the current offset accessor, which default to stackOffsetNone, this uses a zero baseline.
d3.stackOffsetDiverging(series, order)
d3.stackOffsetExpand(series, order)
d3.stackOffsetNone(series, order)


